Using data from a citizen science project involving hundreds of thousands of volunteers, I trained a deep learning model to sort galaxies into two morphological categories and got to peek inside the model to see what it was actually looking at.
Background
Galaxies come in many shapes - sort of. The two most important are smooth (elliptical) galaxies: roughly spherical blobs of stars with no visible structure, and featured/disk (spiral) galaxies: flat disks with often-dramatic spiral arm structures. Classifying galaxy morphology at scale is important for understanding how galaxies form and evolve, but doing it by hand for millions of objects is completely impractical.
Galaxy Zoo 2 was a citizen science project where volunteers were shown images of galaxies and asked to answer a series of questions about their appearance. Their aggregated votes produced confidence scores for each galaxy across many morphological properties. This project uses those labels to train a classifier that can do the job automatically.
The Data
The dataset comes from Galaxy Zoo 2, cross-referenced with imaging from the Sloan Digital Sky Survey (SDSS). Each galaxy is a 424×424 pixel JPEG image paired with a set of vote fractions across classification questions.
For this project, I focused on the top-level classification: is a galaxy smooth, or does it have features? To create clean binary labels, I applied a 0.6 confidence threshold - a galaxy was labeled “smooth” if at least 60% of volunteers voted that way, or “features/disk” if at least 60% voted for features. (This was entirely arbitrary). Galaxies that didn’t meet the threshold for either category were treated as ambiguous and removed.
After filtering, the dataset contained 48,492 galaxies:
| Class | Count | Share |
|---|---|---|
| Smooth (Elliptical) | 19,942 | 41.1% |
| Features/Disk (Spiral) | 28,550 | 58.9% |
The 13,086 ambiguous galaxies that were removed represent the cases where even large groups of human volunteers couldn’t agree — a good argument for leaving them out of the training data.
Exploratory Data Analysis (EDA)
Before modeling, I visualized the distribution of volunteer vote fractions across the three top-level classification categories: smooth, features/disk, and star/artifact (non-galaxy contaminants).
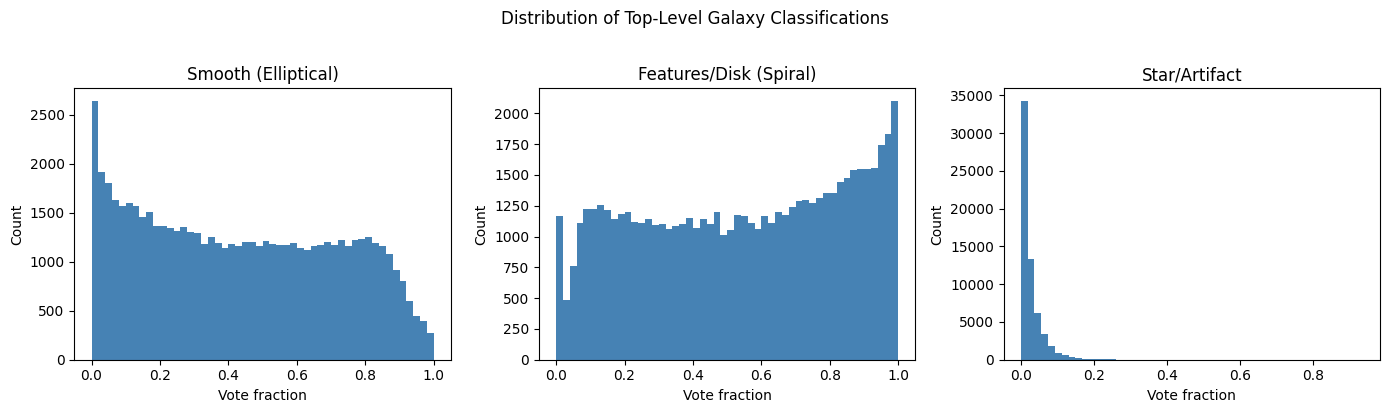
The bimodal structure visible in the smooth and features/disk distributions is a good sign. It means volunteers were generally confident, with most galaxies clustering near 0 or near 1 rather than in the ambiguous middle. This adds some defense to the 0.6 threshold.
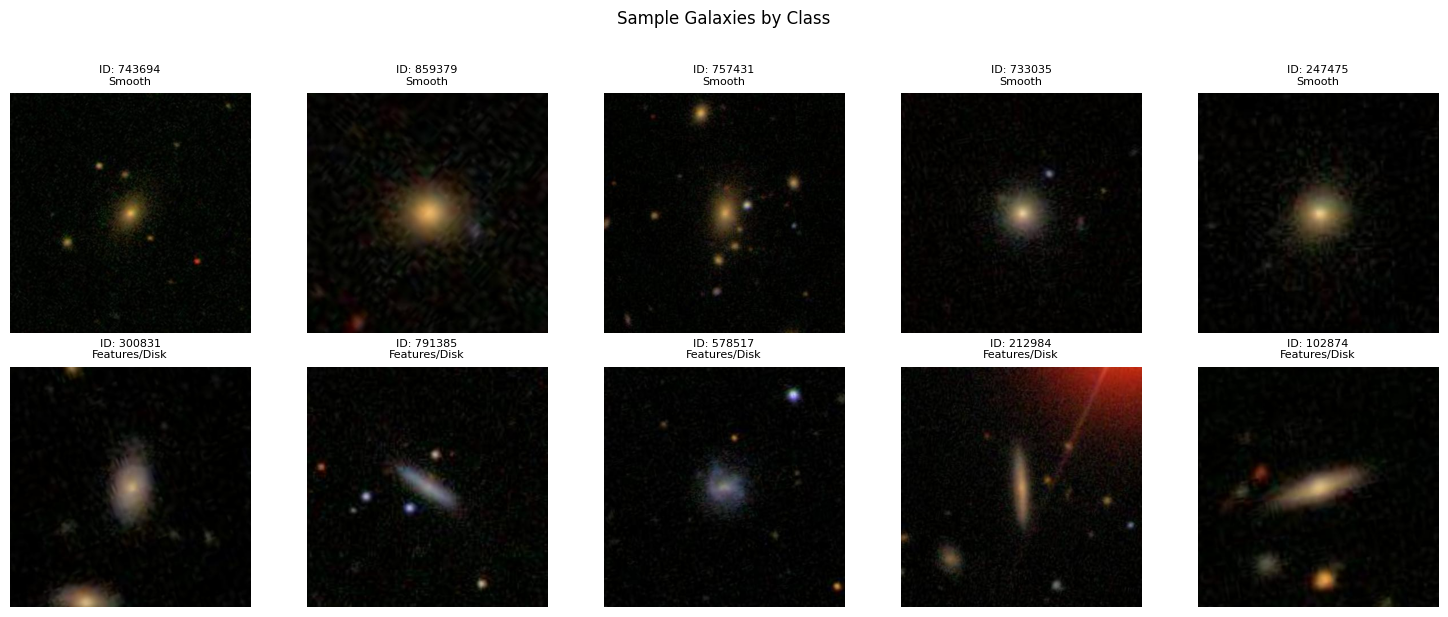
Even by eye, the two classes are visually distinct: smooth galaxies appear as featureless bright blobs, while featured galaxies show visible structure, arms, and asymmetry.
Modeling
The model is built on EfficientNetB0, a convolutional neural network pre-trained on ImageNet. Rather than training a network from scratch, which would require far more data and compute, transfer learning repurposes a model that already understands general image features like edges, textures, and shapes, and fine-tunes it for the specific task of galaxy morphology.
Training happened in two phases:
Phase 1: Head training (10 epochs, lr = 1e-3): The EfficientNetB0 backbone was frozen entirely. Only a single linear classification layer added on top was trained. This lets the model quickly learn which high-level features are relevant for the galaxy task without destabilizing the pre-trained weights.
Phase 2: Fine-tuning (5 epochs, lr = 1e-4): The final three blocks of the backbone were unfrozen and trained alongside the classification head at a much lower learning rate. This allows the deeper layers to adapt their learned representations to the specific visual characteristics of galaxy images.
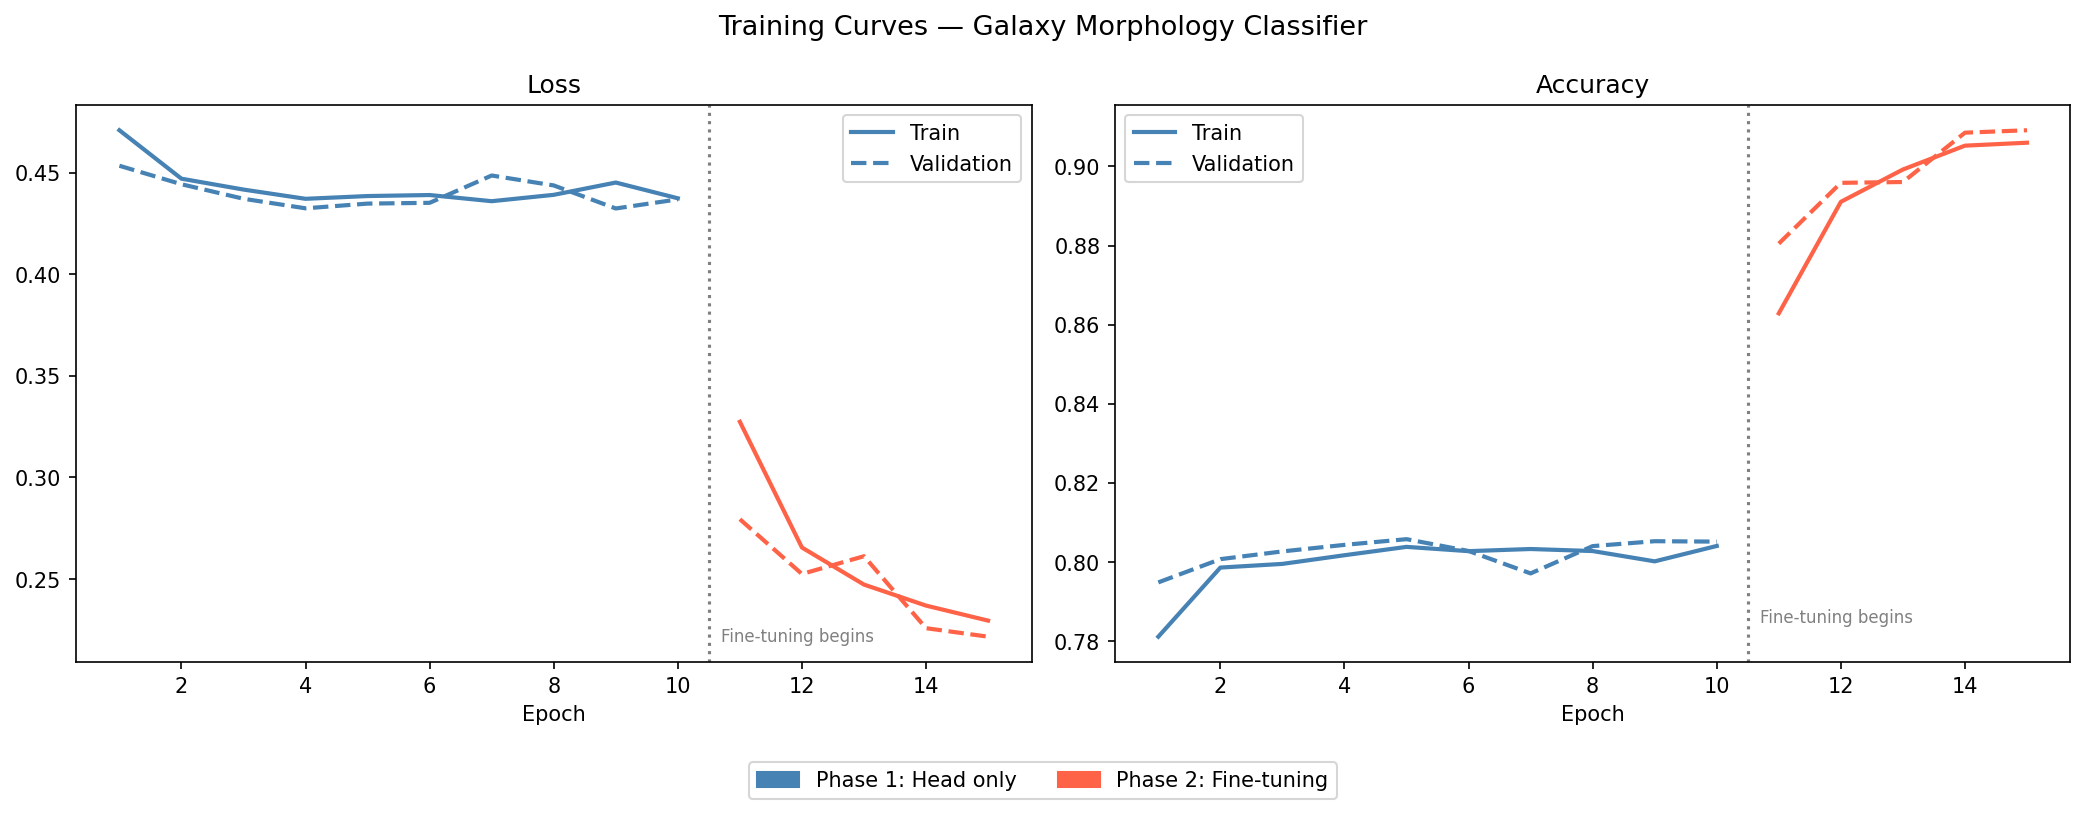
The two-phase structure is visible in the loss curves - Phase 1 shows a rapid initial drop, while Phase 2 shows continued gradual improvement before convergence.
Evaluation
The model was evaluated on a held-out validation set of 9,699 galaxies. Final validation accuracy was approximately 90.9%.
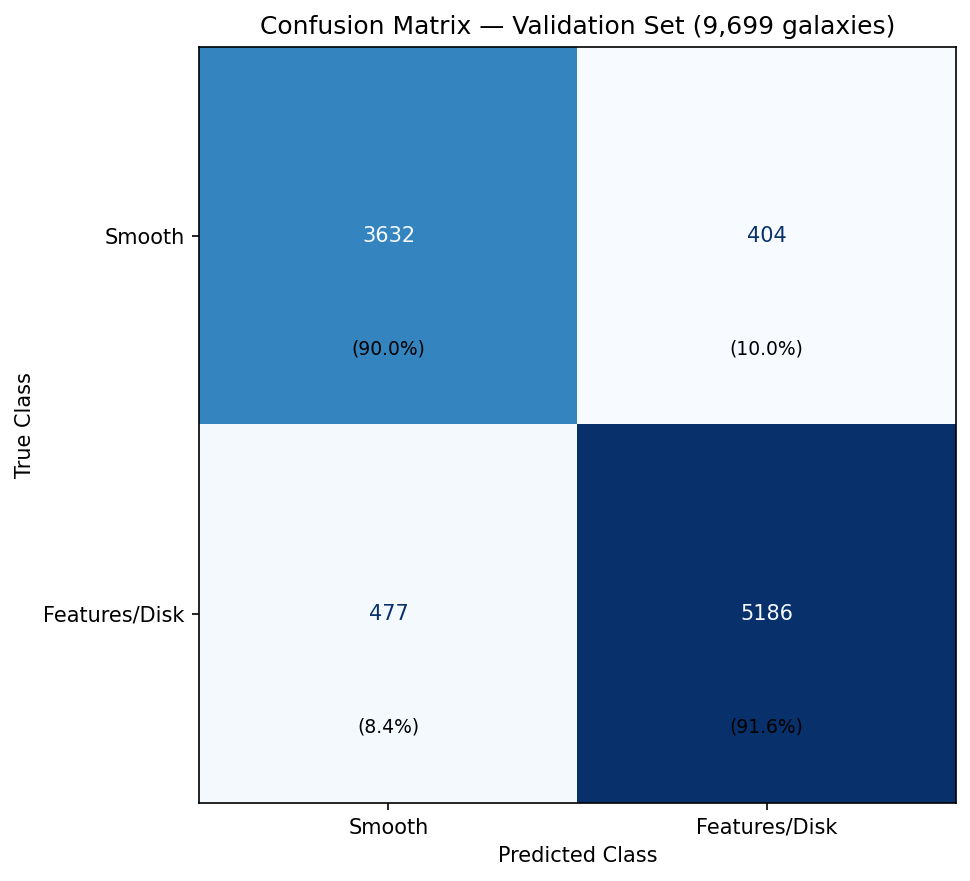
The model performs well on both classes, though, like most classifiers, it has a slight tendency to favor the majority class (features/disk).
One useful check is looking at model confidence: not just whether it was right or wrong, but how sure it was. A well-calibrated model should be more confident on correct predictions than on incorrect ones.
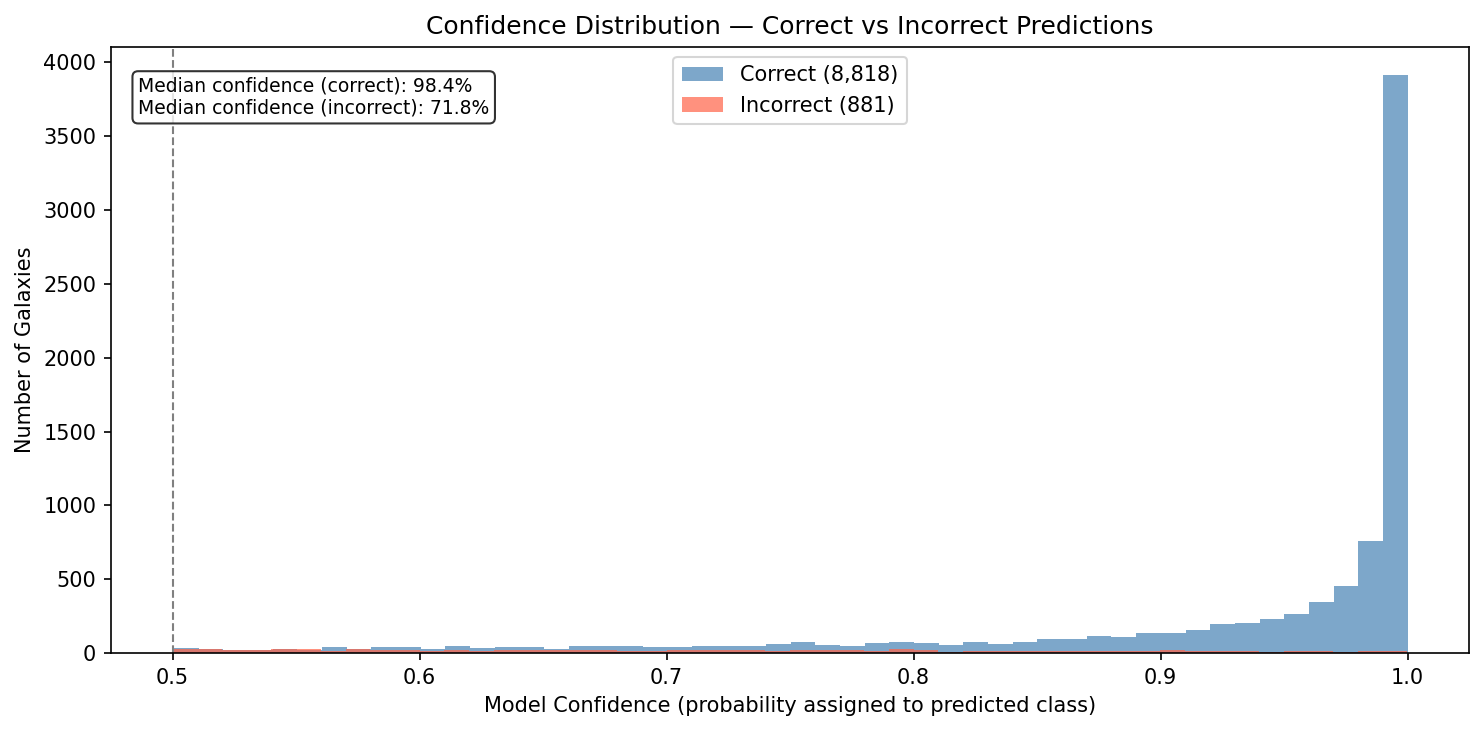
The separation is encouraging. When the model is wrong, it tends to be uncertain about it, which is exactly the behavior you would want in a system where uncertain cases could just be flagged for human review.
- Median confidence on correct predictions: ~0.95
- Median confidence on incorrect predictions: ~0.65
Interpretability with Grad-CAM
Accuracy alone doesn’t tell you whether a model is learning the right things. A model can hit 90% by exploiting image artifacts or survey-specific biases rather than actual galaxy morphology.
Grad-CAM (Gradient-weighted Class Activation Mapping) addresses this by generating a heatmap that highlights which regions of an input image had the most influence on the model’s prediction. More technically, the heatmap is computed by backpropagating the gradient of the predicted class score to the final convolutional layer, then weighting the activations accordingly.
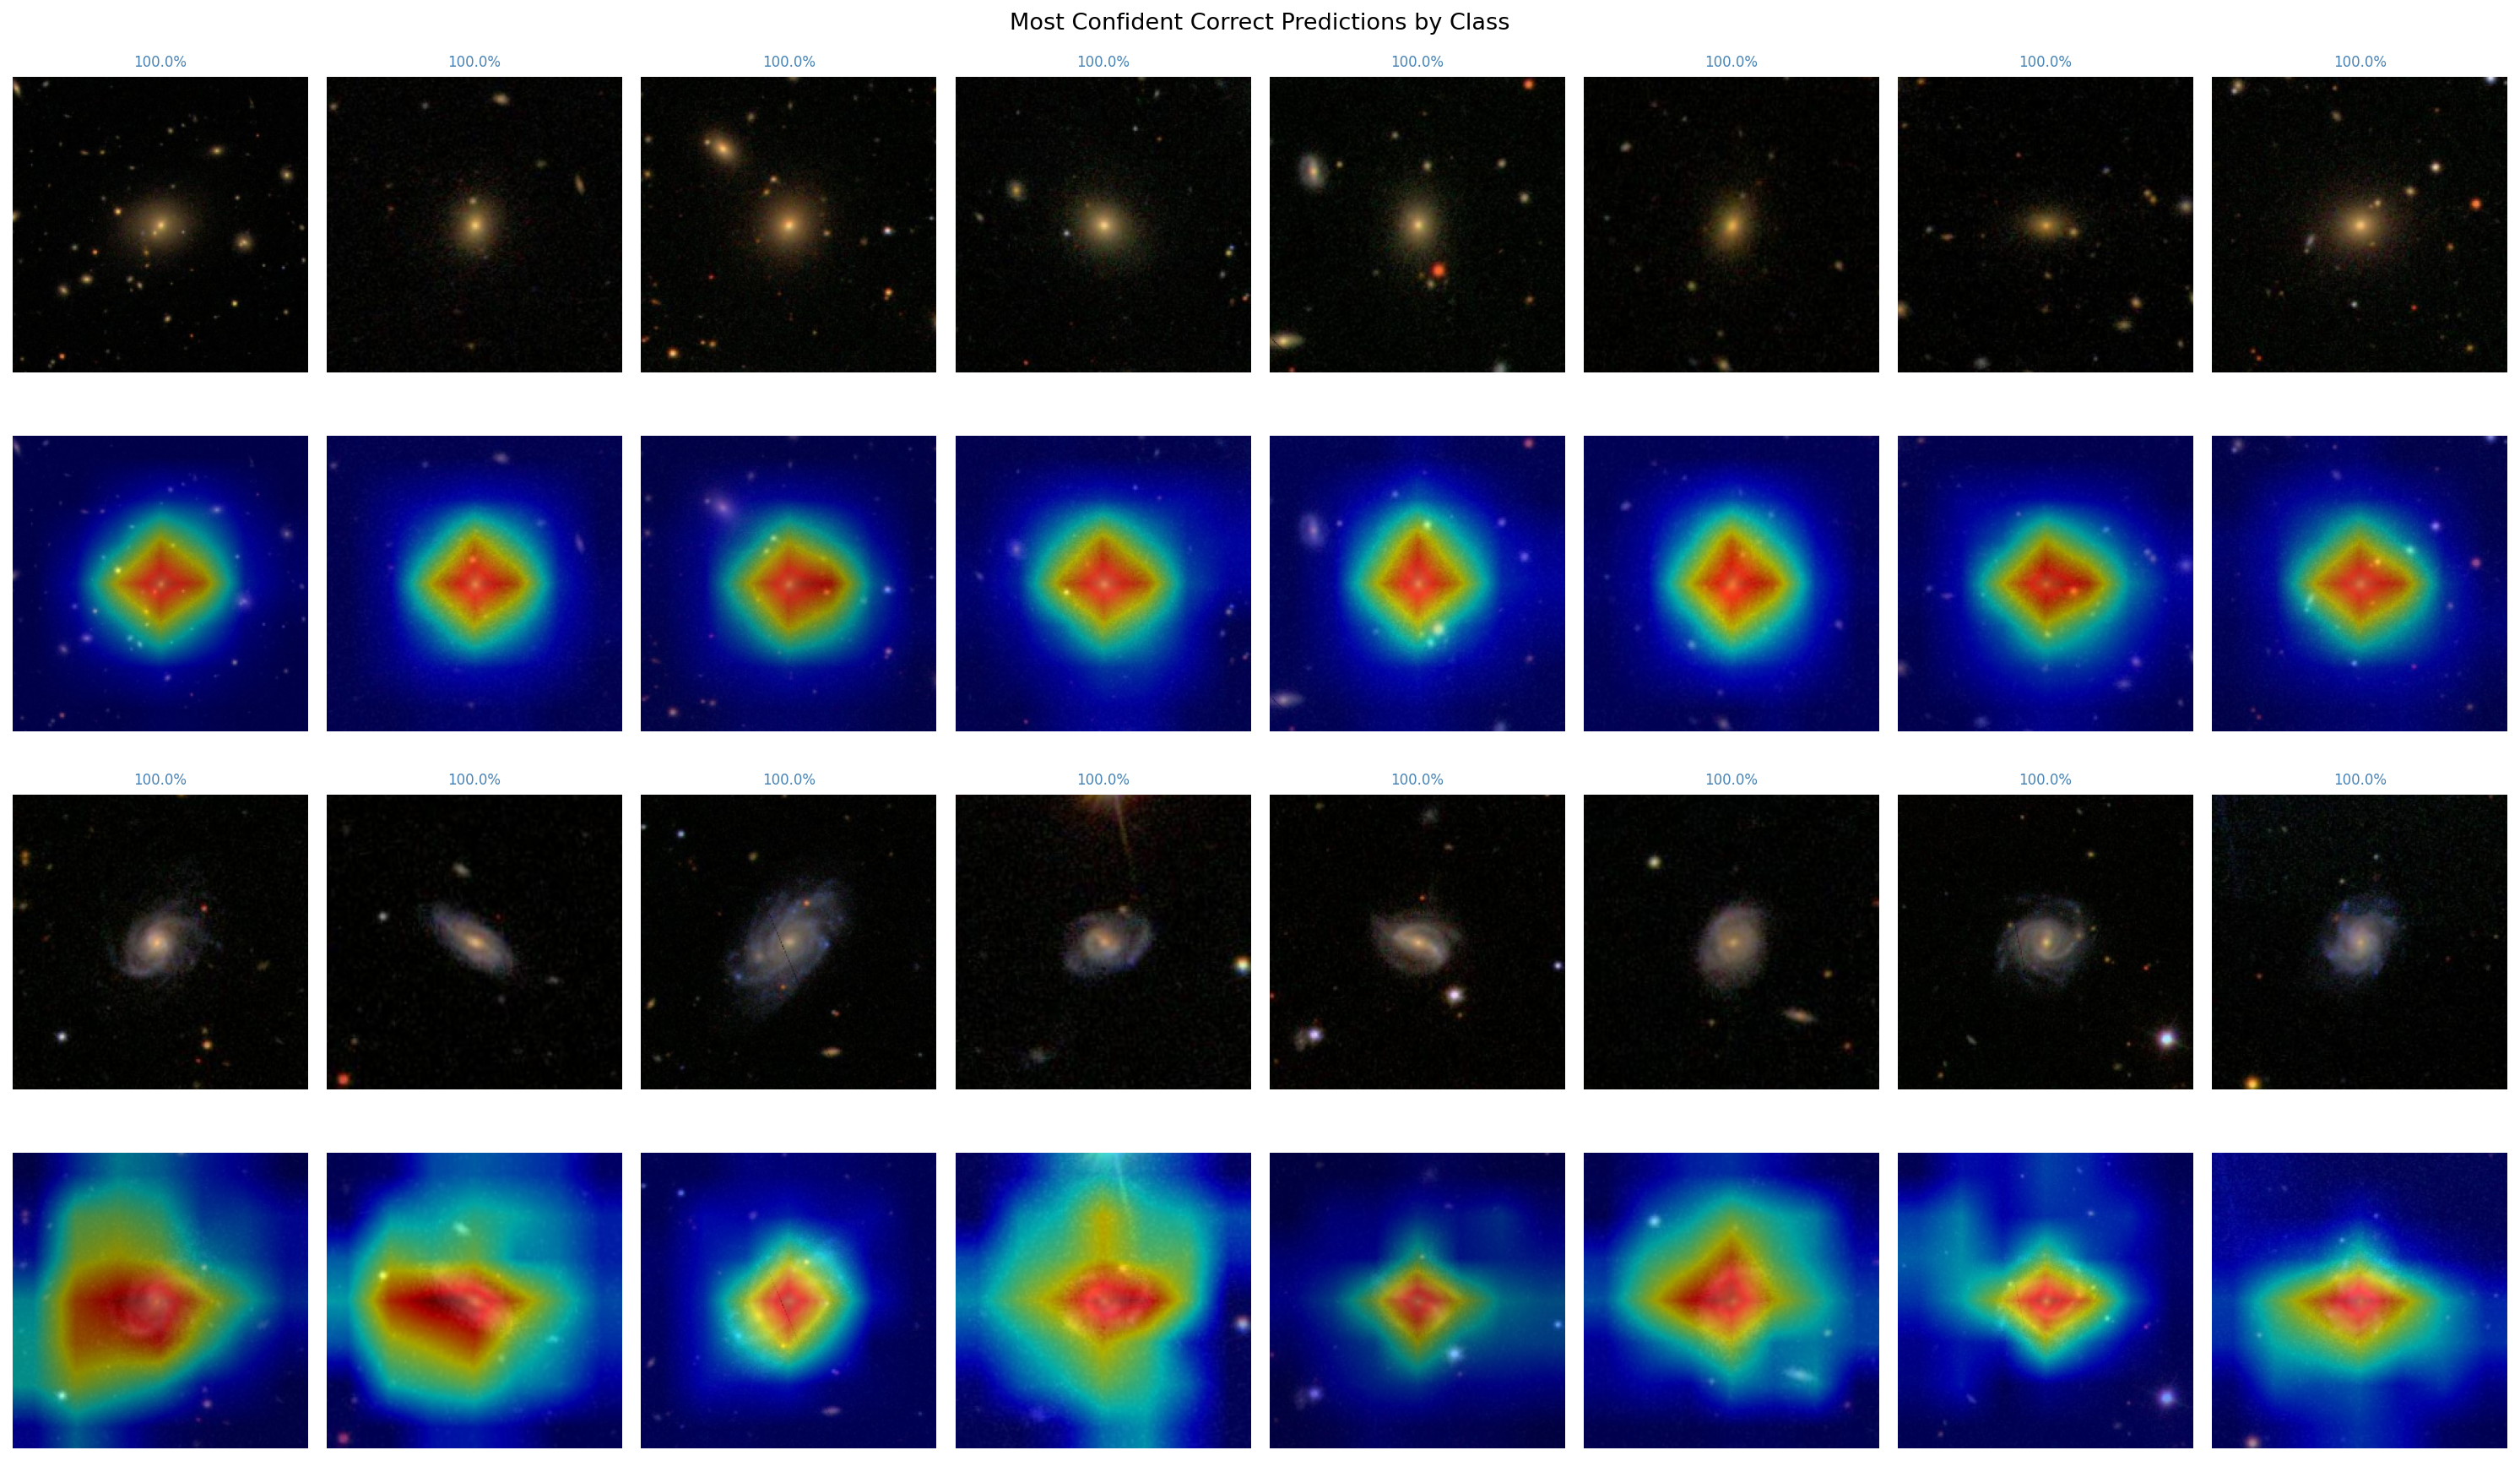
For correct predictions, the model’s attention aligns well with what an astronomer would look at:
- For smooth galaxies, attention concentrates on the bright core region.
- For featured/disk galaxies, attention spreads outward to encompass the disk and arm structures.
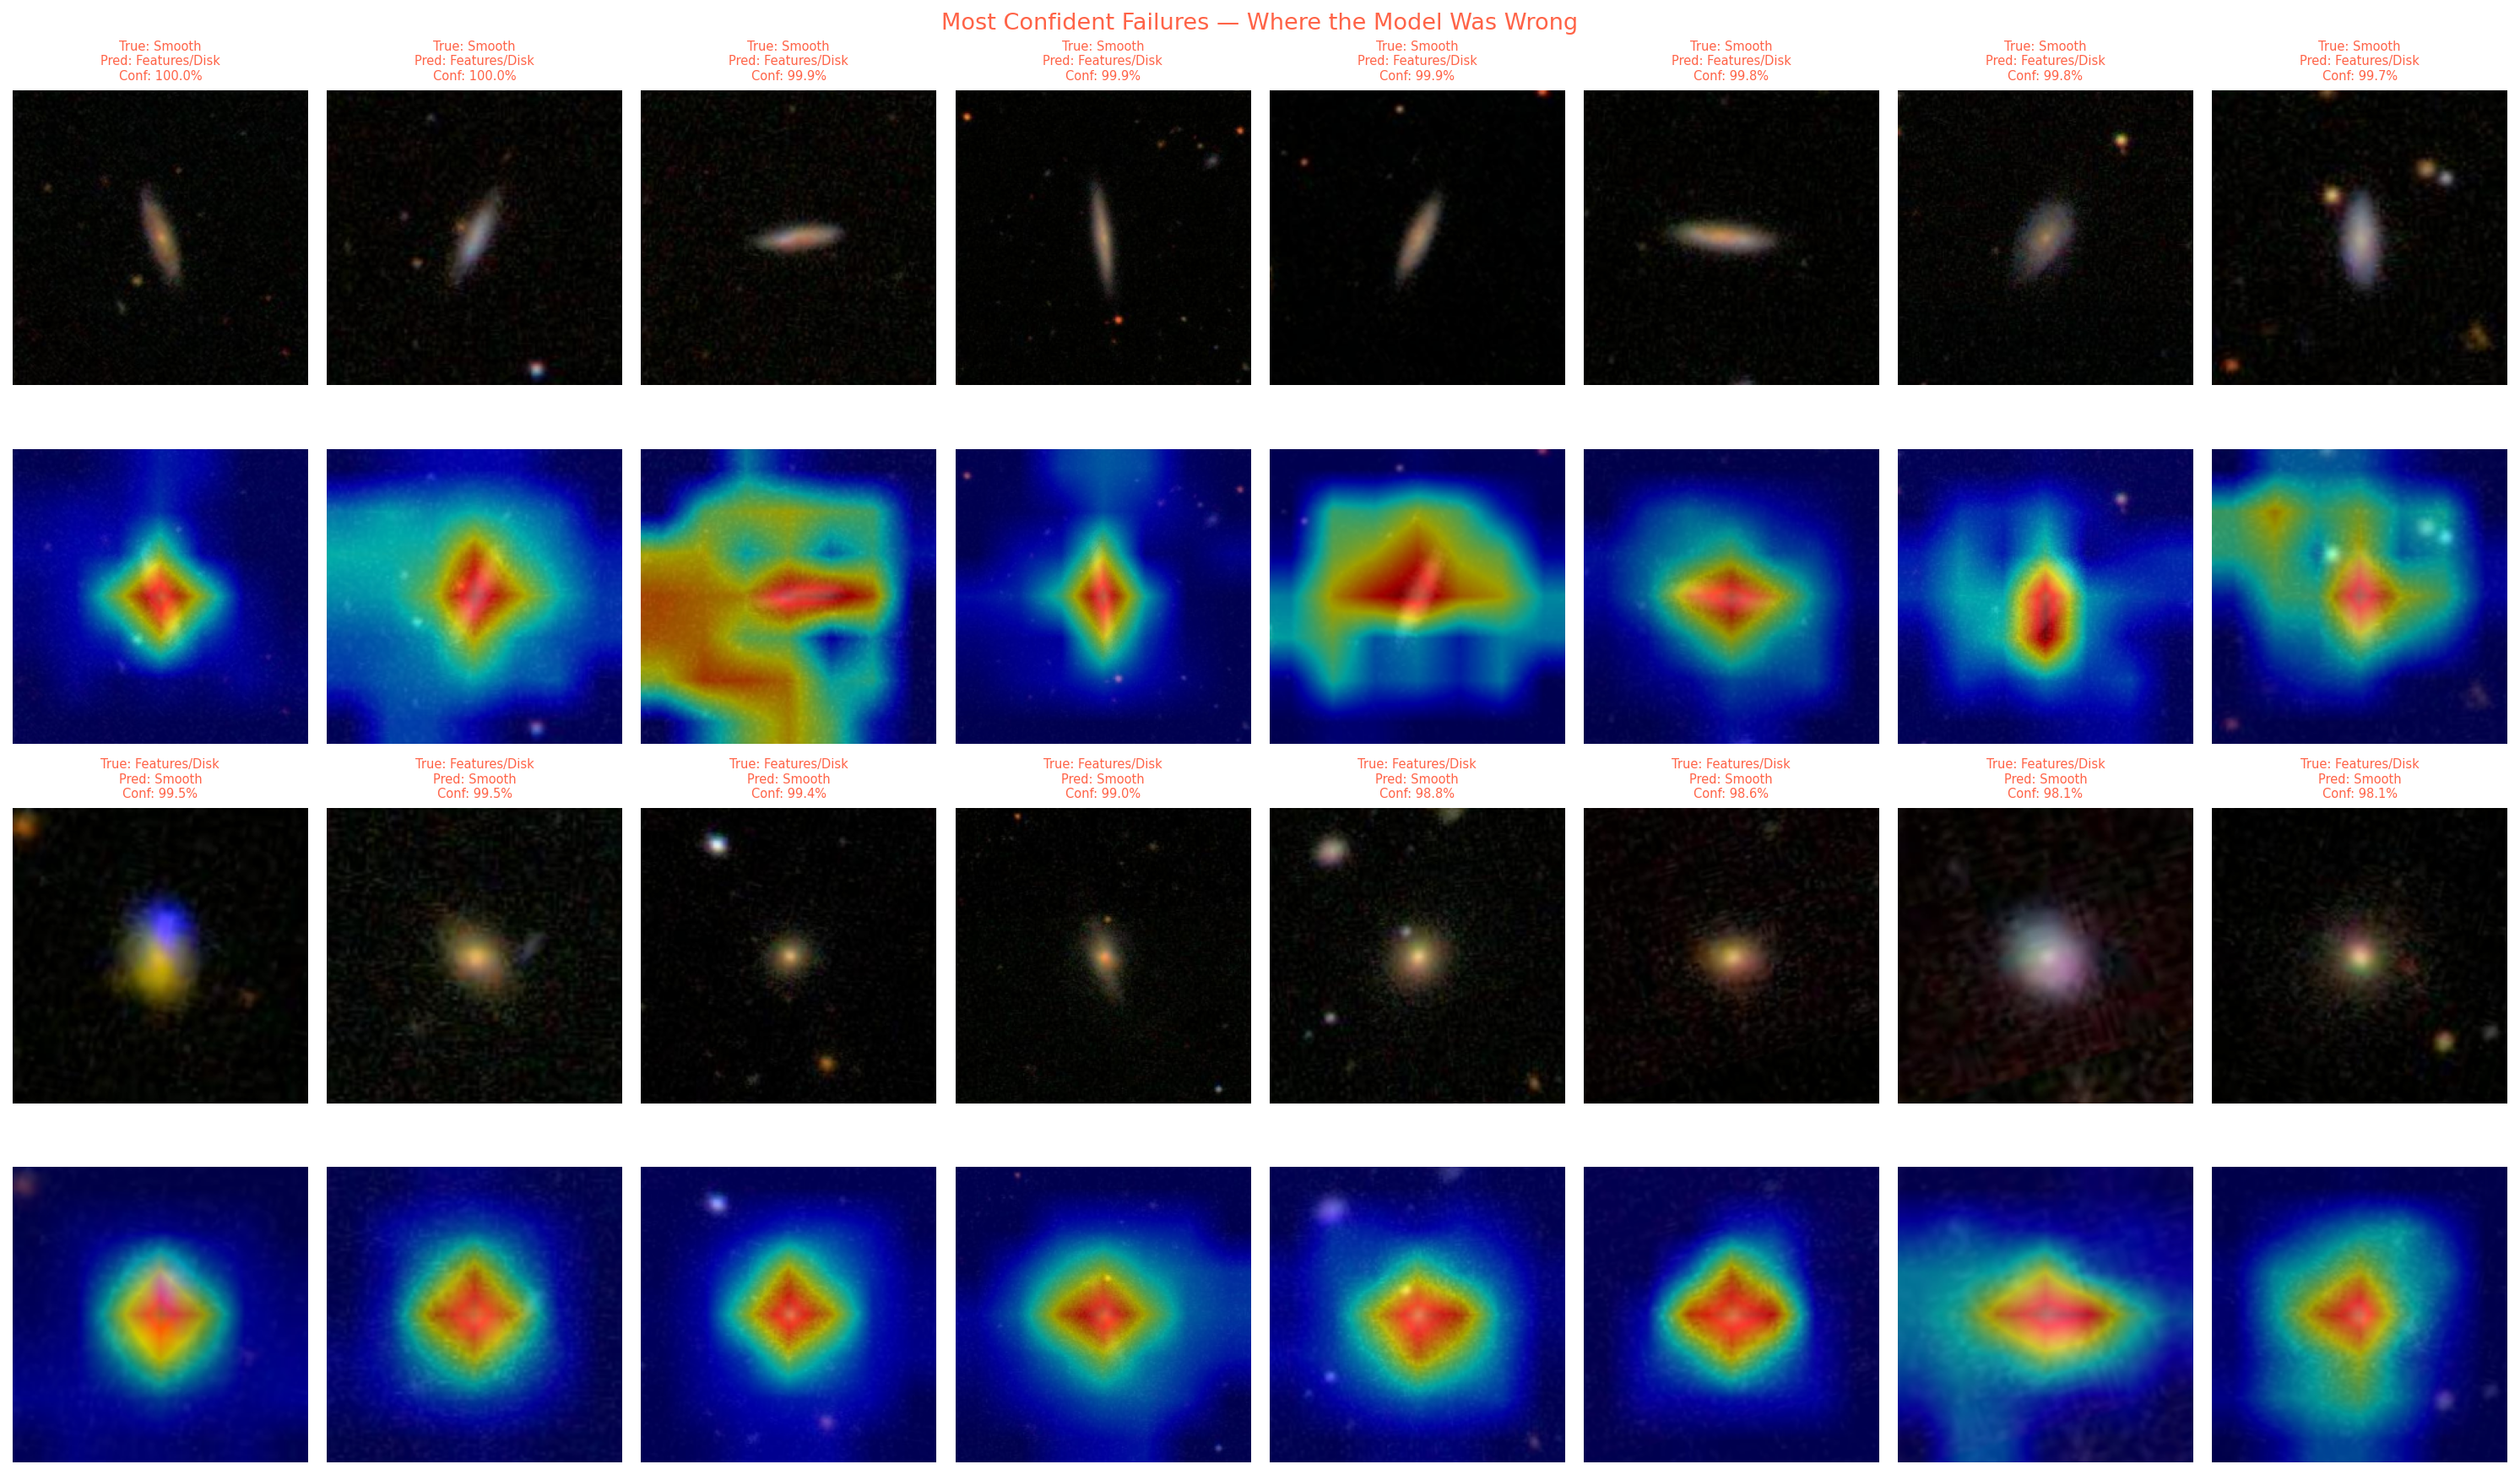
For incorrect predictions, the attention maps sometimes reveal the failure mode: the model may focus on a bright foreground star overlapping with the galaxy, or on the core of a featured galaxy in a way that makes it resemble a smooth one. This kind of qualitative inspection is harder to fake than a good accuracy number.
Conclusion
This project shows that transfer learning from a general-purpose image classifier can be adapted to a specialized scientific task with relatively little data and compute. EfficientNetB0 with two-phase fine-tuning achieves ~90.9% accuracy on galaxy morphology classification, with confidence patterns and Grad-CAM visualizations that suggest the model is paying attention to physically meaningful features.
The 0.6 confidence threshold used for labeling is a reasonable but somewhat arbitrary choice - a tighter threshold would produce a cleaner dataset but fewer labels, while a looser one would include more data but noisier labels. Experimenting with that tradeoff is the most obvious next step.
The full code is available on GitHub.